Bild 10

CT and COPD: AI with previously unknown potential

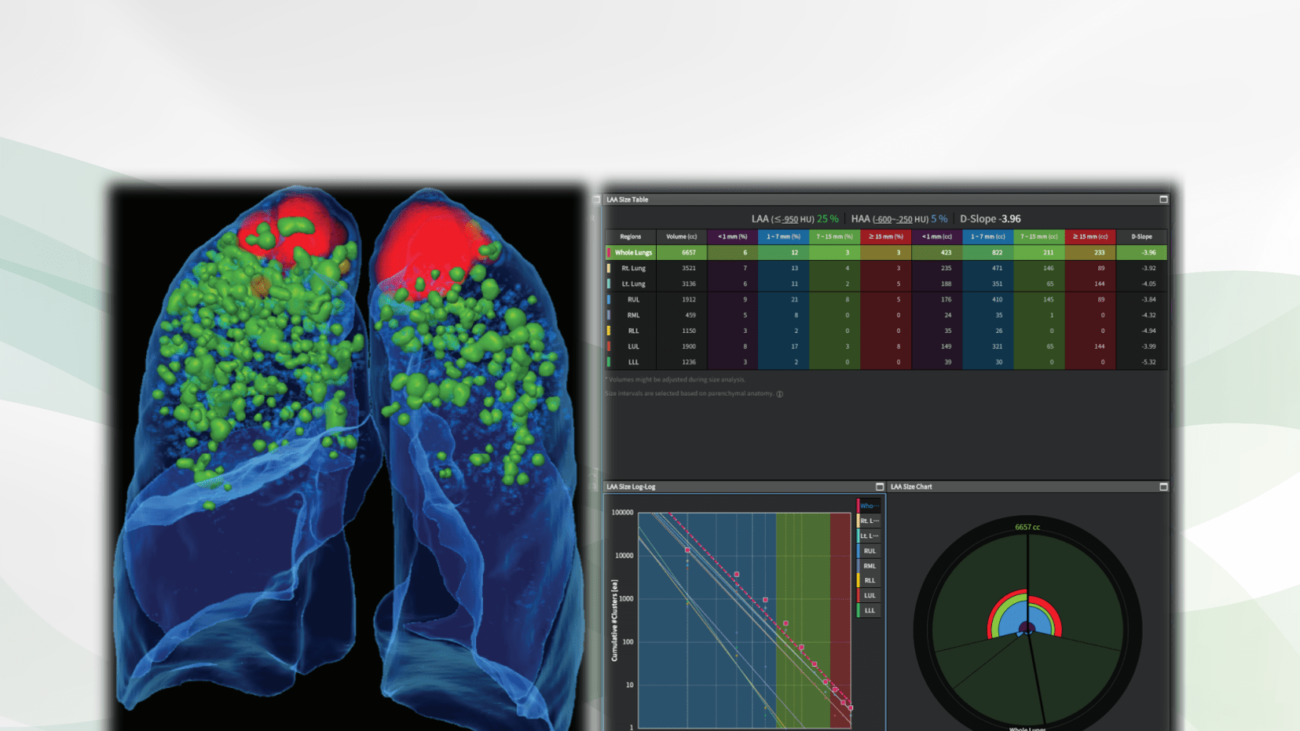
Non-enhanced low-dose chest CT of a patient with COPD. MPR visualization of lung anatomy and emphysema clusters (left) and detailed charts and graphs (right). The absolute volumina and the relative low attenuation volumina (25%) were given for both lungs as well as for each lobe. aview COPD calculated the D-slope as -3.96. This value is considered the diameter of the emphysema clusters plotted against the cumulative number of lesions on a log–log scale. The slope of these linear relationships is calculated, with a steeper slope indicating a smaller emphysema size.

Chronic obstructive pulmonary disease (COPD) is the third most common cause of death around the world. It is generally accepted that CT imaging helps quantify the disease. Until now, lung function analysis has been understood as diagnostic gold standard. Recently, AI demonstrates its full capacity to comprehensively assist in the diagnosis and visualization of the fundamental COPD pathologies in cross sectional imaging.

It is with great pleasure that we present Coreline´s aview COPD, an AI assistant for the detailed visualization of COPD in lung CT studies.

Why aview COPD matters and how it works

The AI assistant classifies and quantitatively analyses two COPD phenotypes, i.e., the airway type and the emphysema type. This automatic segmentation software provides expedite analysis and visualization of the lungs, the lung lobes as well as the pulmonary airways and blood vessels. The results are presented through 2D and 3D images, intuitive charts and detailed graphs. An important key feature is the tracking of disease in follow up CT studies. Hence, aview COPD may serve as an imaging biomarker of diagnosis and lung function. This AI assistant can be used both for individual patients and in large departments for pulmonology.

Who benefits

Patients, clinicians and radiologists by the clear description of major COPD patterns and the follow up tracking of the disease. In particular, the 2D and 3D visualization of the lungs, lobes, airways and blood vessels is a welcome help for interdisciplinary and patient communication.

Our own experience at Radailogy

Coreline reports the AI assistant´s analysis agreement for emphysema, airway and air trapping as 99%, 96% and 99%, respectively. aview COPD offers a variety of MPR images, diagrams and graphs to illustrate the pulmonary anatomy and disease as well as the distribution pattern of COPD. An interesting feature is the analysis and depiction of emphysema clusters using the D-slope value by applying a three-dimensional size-based emphysema clustering technique. For the calculation of D-slope, the diameter of the emphysema cluster is plotted against the cumulative number of lesions on a log–log scale. The slope (D-slope) of these linear relationships is calculated, with a steeper slope (increase in absolute D value) indicating a smaller emphysema size. The airway and lung vessel segmentation, the morphology and pathology of the airway walls and diameter are shown by 3D images and detailed tables. In our opinion, the fissure analysis is of limited help. Overall, the visualized contents enhance the understanding of pulmonary morphology and pathology.  We consider aview COPD capable of shortening the radiologists´ workload while increasing the professional efficiency.

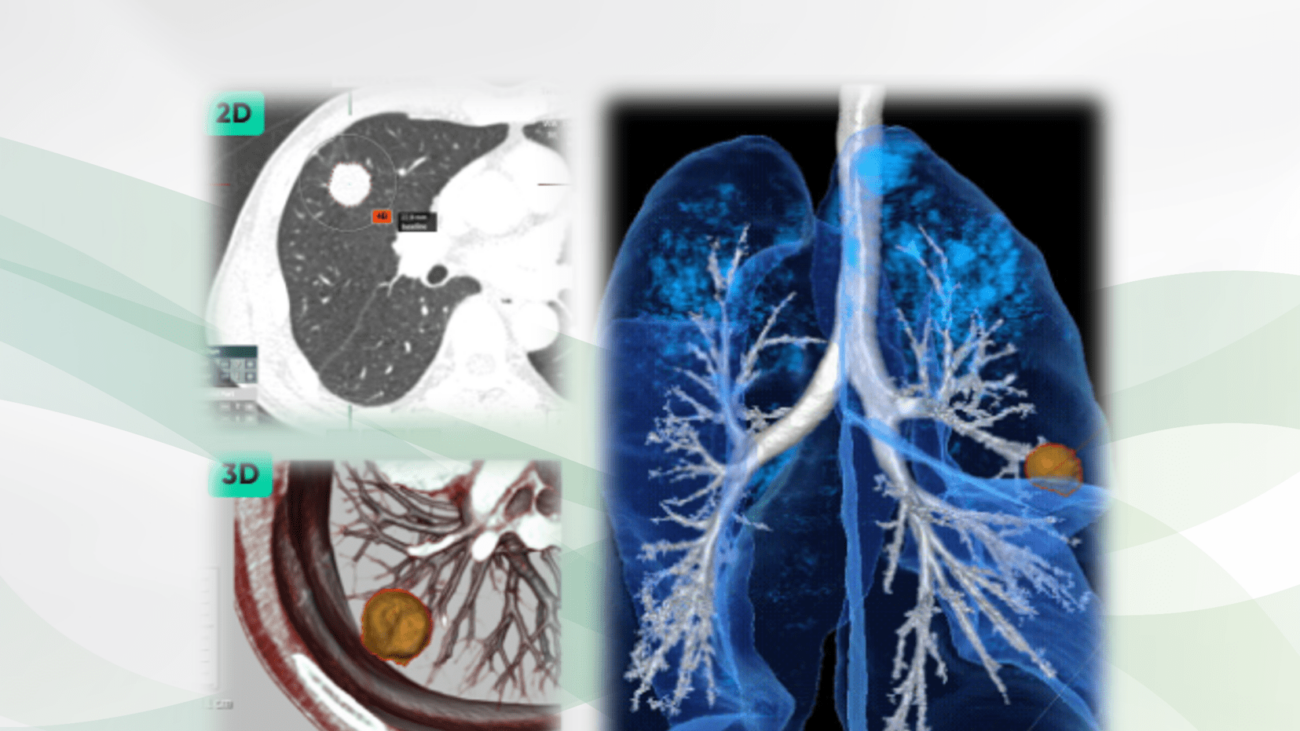
We also evaluated aview COPD together with aview LCS, which was developed to detect and quantify pulmonary nodules in CT studies. Find out more in our AI assistant menu!

The scientific evidence

Hwang HJ, Lee SM, Seo JB, Lee JS, Kim N, Lee SW, Oh YM. New Method for Combined Quantitative Assessment of Air-Trapping and Emphysema on Chest Computed Tomography in Chronic Obstructive Pulmonary Disease: Comparison with Parametric Response Mapping. Korean J Radiol. 2021 Oct;22(10):1719-1729.

Hwang HJ, Seo JB, Lee SM, Kim N, Yi J, Lee JS, Lee SW, Oh YM, Lee SD. Visual and Quantitative Assessments of Regional Xenon-Ventilation Using Dual-Energy CT in Asthma-Chronic Obstructive Pulmonary Disease Overlap Syndrome: A Comparison with Chronic Obstructive Pulmonary Disease. Korean J Radiol. 2020 Sep;21(9):1104-1113.

Data to upload to Radailogy

Non-enhanced low-dose chest CT studies of any CT scanner; axial reformations; slice thickness and interval 1.0 mm each; lung reconstruction kernel

Bild 7

Lung CT: Reduce your workload and increase your diagnostic accuracy!

Non-enhanced low-dose chest CT of a 59-year-old male patient with lung cancer. A spiculated pulmonary nodule is visible at the base of the right upper lobe (upper left). aview LCS indicates the diameter, the volume as well as the morphology of the mass. In addition, the lesion is shown in clear 3D visualizations in relation to the vessels, the airways as well as the Interlobia (lower left and right).

Since lung nodules occur in more than two million people per year in Europe alone and the mortality rate from lung cancer worldwide is around two million annually, precise reporting microscopic nodules demands a variety of information, including the number of nodules, the size and status. In this setting, the strength of AI assistants is to reduce the radiologists´ workload and to allow highly accurate reports. In particular, providing high quality follow-up assessment shows the potential of AI assistants.

It is with great pleasure that we present Coreline´s aview LCS, an AI assistant for the detection of pulmonary nodules in CT studies.

Why aview LCS matters and how it works

The AI assistant detects and diagnoses lung nodules on chest CT studies. It provides 2D and 3D size and volume information by segmenting nodules, and automatically classifies solid, part-solid, non-solid. An important function is the automated comparison of nodules in the CT follow up. aview LCS reports according to the guidelines of the Lung CT Screening Reporting and Data System (Lung-RADS Version 1.1), as recommended by the American College of Radiology. The results are presented in tabular form and with 2D and 3D images. Each individual nodule is described with its exact location, diameter, volume and its morphology. The clear reports in words and images are a welcome support for the transfer of knowledge from radiologists to patients and clinicians. If aview LCS is used for general lung cancer screening, a workload reduction of between 77.4% and 86.7% can be expected according to the reference in our “The scientific evidence” section. This AI assistant can be used both for individual patients and in large oncology departments.

Who benefits

Patients, clinicians and radiologists by the reliable detection of pulmonary nodules with clear reports. In particular, the 2D and 3D visualization of the lungs and the nodules are a welcome help for interdisciplinary and patient communication.

Our own experience at Radailogy

Coreline reports the performance data as: sensitivity 97%, specificity 76%, accuracy 91%, ROC AUC .76, respectively.  The AI assistant has high values ​​for PPV, NPV and sensitivity of more than 92% each in our own patient population for lung nodules larger than 10mm. Lesions are precisely located and described using the parameters diameter, volume and morphology. Two CT studies are compared in the follow-up setting. The status of each nodule is indicated as baseline, unchanged, smaller or larger, respectively. New nodules are reported as such. This automated comparison in follow-up lung CTs reduces much of the workload. However, we could not validate the reduction of the workload by 86.7% and the time saving of 70% suggested by the vendor.

We also evaluated aview LCS together with aview COPD, which was developed to detect and quantify pulmonary emphysema in lung CT studies. Find out more in our AI assistant menu!

The scientific evidence

Lancaster HL, Zheng S, Aleshina OO, Yu D, Yu Chernina V, Heuvelmans MA, de Bock GH, Dorrius MD, Willem Gratama J, Morozov SP, Gombolevskiy VA, Silva M, Yi J, Oudkerk M. Outstanding negative prediction performance of solid pulmonary nodule volume AI for ultra-LDCT baseline lung cancer screening risk stratification. Lung Cancer. 2022 Jan 6;165:133-140.

Data to upload to Radailogy

Non-enhanced low-dose chest CT studies of any CT scanner; axial reformations; slice thickness and interval below 1.25mm each; sharp lung reconstruction kernel

Bild3

Do you know your risk of heart attack? Done quickly with aview CAC!

Non-enhanced chest CT of a 65-year-old patient; 120 Kvp; axial reformation; soft tissue reconstruction kernel. aview CAC segments all cardiac structures and detects coronary artery calcium in all coronary arteries, calculates an Agatston score of 2613, a visually estimated score of 2053, the total area of ​​calcifications of 2220.6 mm² and the equivalent amount of calcium of 471.8 mg. The score according to the CAC-DRS scoring system is 2613/N4 and represents a high risk of a heart attack.

Calcium deposits narrow the coronary arteries and increase the risk of a heart attack. Calcium scoring in a simple CT scan of the chest provides information about whether your coronary arteries are affected by this arteriosclerosis.

It is with great pleasure that we present aview CAC, an AI assistant for the CT of the heart.

Why aview CAC matters and how it works

Coronary artery calcium (CAC) is a marker of overall coronary atherosclerotic burden. As such, it is an important tool in cardiovascular risk stratification and preventive treatment of asymptomatic patients with unclear cardiovascular disease risk.

aview CAC is a new AI assistant for coronary artery segmentation and labeling. It detects and analyzes calcium in the coronary arteries using CT scans of the chest by measuring the Agatston score.

Patients with a high Agatston score are at increased risk of a heart attack.

Who benefits

Taking your age and gender into account, aview CAC can be used to calculate how high your risk of a heart attack is.

If you have already had a screening CT of your lungs, you can upload this study to Radailogy and you will receive information about this risk quickly and reliably.

If coronary artery calcium is detected, coronary disease is more likely, regardless of whether you feel symptoms or not. It also means that possible follow-up examinations (CT angiography of the coronary arteries or MRI of the heart) allow conclusions to be drawn about the development of the disease and the effectiveness of therapy.

Our own experience at Radailogy

aview CAC calculates the results according to the CAC-DRS Scoring System. The AI assistant uses the modifier “Ax” or “Vx” to represent the Agatston or visually estimated CAC score, respectively, with x corresponding to the CAC score category. Next, the number of affected arteries is outlined with the modifier “Ny,” with y corresponding to the number of affected categories.

Both modifiers are then combined and separated by a virgule to give a composite CAC-DRS score (Ax/Ny or Vx/Ny). The calculation is based on the weighted highest density score (HU) multiplied by the area of the calcification speck. The density score outlines the risk factor: 130-199 HU: 1; 200-299 HU: 2; 300-399 HU: 3; 400+ HU: 4.

The test is performed quickly and accurately with low interreader variation. In addition, aview CAC´s proprietary kernel conversion technology improves accuracy and performance for quick analysis. The results are demonstrated in clear numbers and well understandable pictures.

The scientific evidence

Vonder M, Zheng S, Dorrius MD, van der Aalst CM, de Koning HJ, Yi J, Yu D, Gratama JWC, Kuijpers D, Oudkerk M. Deep Learning for Automatic Calcium Scoring in Population-Based Cardiovascular Screening. JACC Cardiovasc Imaging. 2022 Feb;15(2):366-367.

Aldana-Bitar J, Cho GW, Anderson L, Karlsberg DW, Manubolu VS, Verghese D, Hussein L, Budoff MJ, Karlsberg RP. Artificial intelligence using a deep learning versus expert computed tomography human reading in calcium score and coronary artery calcium data and reporting system classification. Coron Artery Dis. 2023 Sep 1;34(6):448-452.

Suh YJ, Kim C, Lee JG, Oh H, Kang H, Kim YH, Yang DH. Fully automatic coronary calcium scoring in non-ECG-gated low-dose chest CT: comparison with ECG-gated cardiac CT. Eur Radiol. 2023 Feb;33(2):1254-1265.

Data to upload to Radailogy

Non-enhanced chest CT studies of any CT scanner; 120 Kvp; axial reformations; slice thickness and interval 2.5-3 mm each; soft tissue reconstruction kernel