Team Radailogy ECR 2025

We place human awareness and human responsibility above the power of AI

We are honored to receive the Newcomer of the Year Industry Award at ECR 2025. Our congress team (from left to right): Conny Schueller, Gerd Schueller, Jimmy Beständig, Andrea Rockall, Michael Peck, Aferdita Bogdanovic, Markus Lang

Was the European Congress of Radiology ECR 2025 our success? How can we understand and evaluate success as an exhibitor at a medical congress? Is it because we conducted countless contract negotiations? Is it because we made money? All of them, no!

Our success with ERS and Radailogy goes beyond business figures

ERS and Radiology have been recognized as trendsetters who always puts people’s well-being first. We offer our teleradiology and artificial intelligence to quickly and clearly give people the reassurance they need to make important decisions immediately:

Can I go home from the doctor’s office without treatment, allowing me to continue my life with joy and serenity without worry? Or is my decision to seek treatment now the better one for quickly regaining my health? Above all, I don’t have to worry about any unclear information about whether my medical report might mean that no one knows for sure whether my health is at risk or not.

We apply all our knowledge to enable these very decisions, every day of the year, for people all over the world

We have become the market leader in teleradiology not only because our customers rely on our clear decisions.

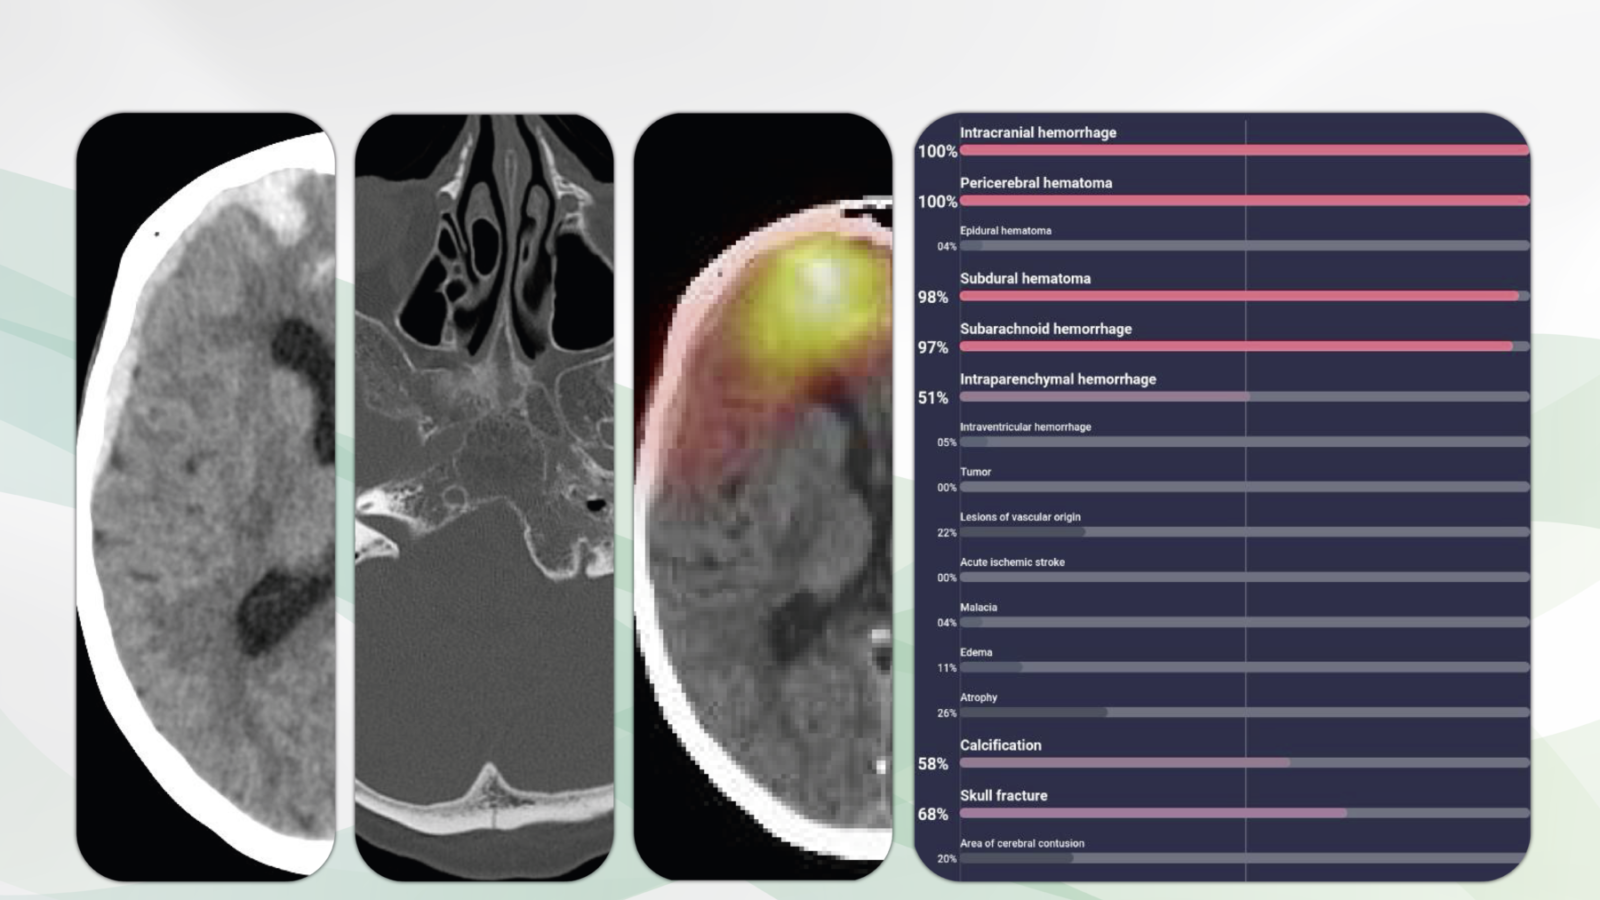
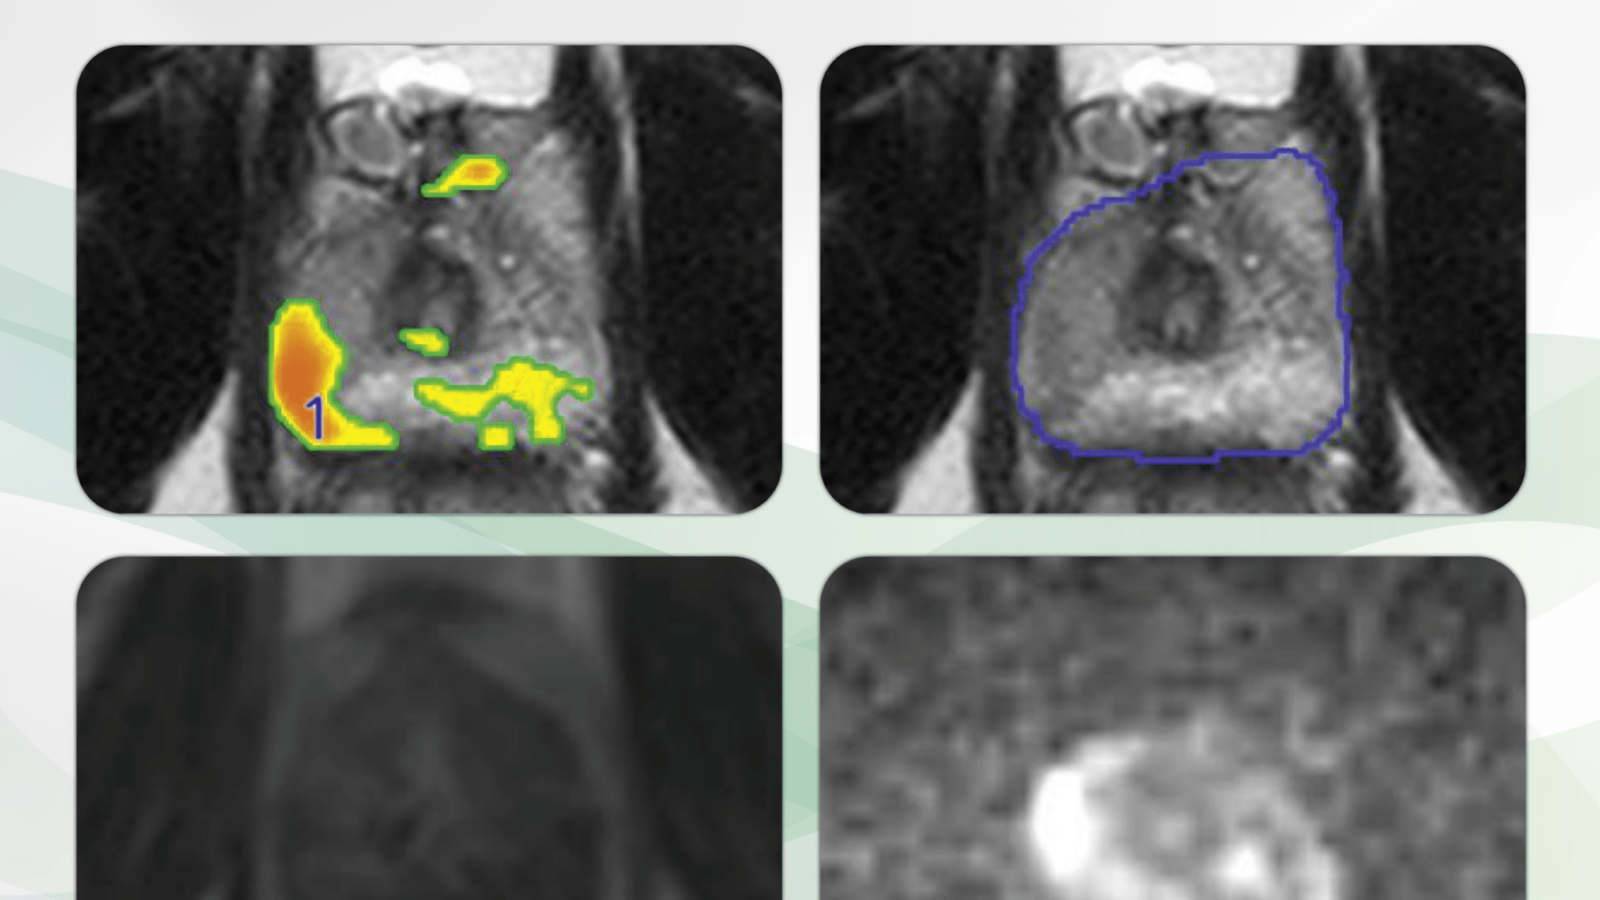
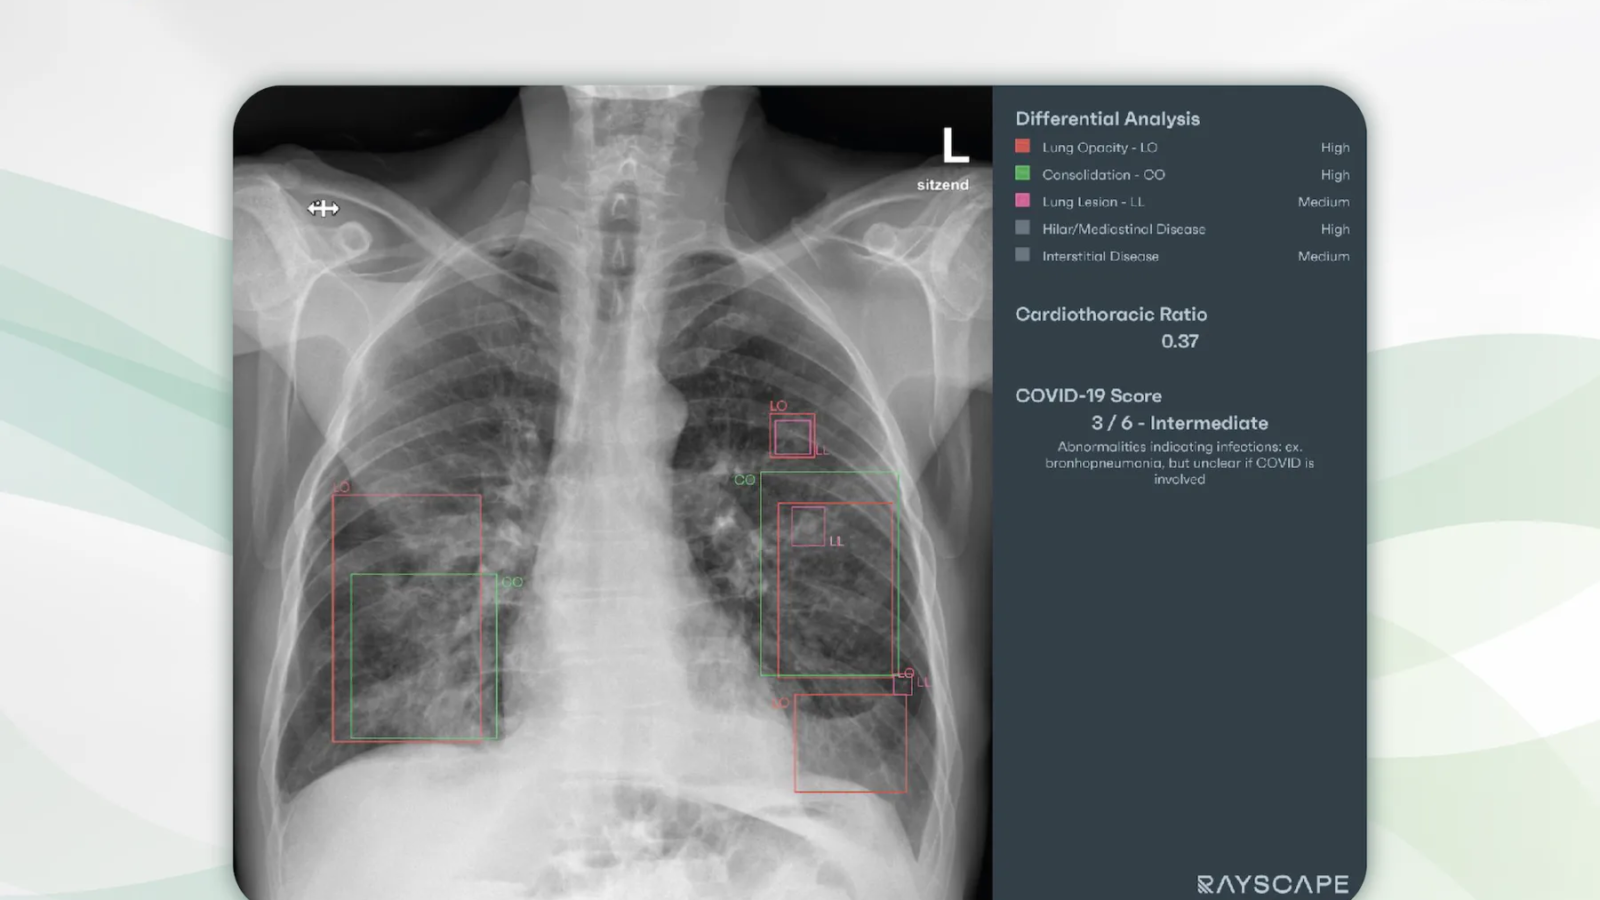
With Radailogy, we implement additional machine results with great care and diligence. And it is precisely at this interface that it is crucial to carefully review the AI ​​assistant’s results for each individual and integrate them into our human responsibility, i.e., our medical reports.

We conveyed these human values. That´s what it´s all about. That´s what our success is all about

ECR 2025 has shown that our unique path is also the only right one. Thank you to everyone who helped make our participation in ECR 2025 in Vienna such a wonderful celebration.


Yours,

Gerd Schueller

Coreline AI assistant aview COPD

CT and COPD: AI with previously unknown potential

Non-enhanced low-dose chest CT of a patient with COPD. MPR visualization of lung anatomy and emphysema clusters (left) and detailed charts and graphs (right). The absolute volumina and the relative low attenuation volumina (25%) were given for both lungs as well as for each lobe. aview COPD calculated the D-slope as -3.96. This value is considered the diameter of the emphysema clusters plotted against the cumulative number of lesions on a log–log scale. The slope of these linear relationships is calculated, with a steeper slope indicating a smaller emphysema size.

Chronic obstructive pulmonary disease (COPD) is the third most common cause of death around the world. It is generally accepted that CT imaging helps quantify the disease. Until now, lung function analysis has been understood as diagnostic gold standard. Recently, AI demonstrates its full capacity to comprehensively assist in the diagnosis and visualization of the fundamental COPD pathologies in cross sectional imaging.

It is with great pleasure that we present Coreline´s aview COPD, an AI assistant for the detailed visualization of COPD in lung CT studies.

Why aview COPD matters and how it works

The AI assistant classifies and quantitatively analyses two COPD phenotypes, i.e., the airway type and the emphysema type. This automatic segmentation software provides expedite analysis and visualization of the lungs, the lung lobes as well as the pulmonary airways and blood vessels. The results are presented through 2D and 3D images, intuitive charts and detailed graphs. An important key feature is the tracking of disease in follow up CT studies. Hence, aview COPD may serve as an imaging biomarker of diagnosis and lung function. This AI assistant can be used both for individual patients and in large departments for pulmonology.

Who benefits

Patients, clinicians and radiologists by the clear description of major COPD patterns and the follow up tracking of the disease. In particular, the 2D and 3D visualization of the lungs, lobes, airways and blood vessels is a welcome help for interdisciplinary and patient communication.

Our own experience at Radailogy

Coreline reports the AI assistant´s analysis agreement for emphysema, airway and air trapping as 99%, 96% and 99%, respectively. aview COPD offers a variety of MPR images, diagrams and graphs to illustrate the pulmonary anatomy and disease as well as the distribution pattern of COPD. An interesting feature is the analysis and depiction of emphysema clusters using the D-slope value by applying a three-dimensional size-based emphysema clustering technique. For the calculation of D-slope, the diameter of the emphysema cluster is plotted against the cumulative number of lesions on a log–log scale. The slope (D-slope) of these linear relationships is calculated, with a steeper slope (increase in absolute D value) indicating a smaller emphysema size. The airway and lung vessel segmentation, the morphology and pathology of the airway walls and diameter are shown by 3D images and detailed tables. In our opinion, the fissure analysis is of limited help. Overall, the visualized contents enhance the understanding of pulmonary morphology and pathology.  We consider aview COPD capable of shortening the radiologists´ workload while increasing the professional efficiency.

We also evaluated aview COPD together with aview LCS, which was developed to detect and quantify pulmonary nodules in CT studies. Find out more in our AI assistant menu!

The scientific evidence

Hwang HJ, Lee SM, Seo JB, Lee JS, Kim N, Lee SW, Oh YM. New Method for Combined Quantitative Assessment of Air-Trapping and Emphysema on Chest Computed Tomography in Chronic Obstructive Pulmonary Disease: Comparison with Parametric Response Mapping. Korean J Radiol. 2021 Oct;22(10):1719-1729.

Hwang HJ, Seo JB, Lee SM, Kim N, Yi J, Lee JS, Lee SW, Oh YM, Lee SD. Visual and Quantitative Assessments of Regional Xenon-Ventilation Using Dual-Energy CT in Asthma-Chronic Obstructive Pulmonary Disease Overlap Syndrome: A Comparison with Chronic Obstructive Pulmonary Disease. Korean J Radiol. 2020 Sep;21(9):1104-1113.

Data to upload to Radailogy

Non-enhanced low-dose chest CT studies of any CT scanner; axial reformations; slice thickness and interval 1.0 mm each; lung reconstruction kernel

Coreline AI assistant Lung CT

Lung CT: Reduce your workload and increase your diagnostic accuracy!

Non-enhanced low-dose chest CT of a 59-year-old male patient with lung cancer. A spiculated pulmonary nodule is visible at the base of the right upper lobe (upper left). aview LCS indicates the diameter, the volume as well as the morphology of the mass. In addition, the lesion is shown in clear 3D visualizations in relation to the vessels, the airways as well as the Interlobia (lower left and right).

Since lung nodules occur in more than two million people per year in Europe alone and the mortality rate from lung cancer worldwide is around two million annually, precise reporting microscopic nodules demands a variety of information, including the number of nodules, the size and status. In this setting, the strength of AI assistants is to reduce the radiologists´ workload and to allow highly accurate reports. In particular, providing high quality follow-up assessment shows the potential of AI assistants.

It is with great pleasure that we present Coreline´s aview LCS, an AI assistant for the detection of pulmonary nodules in CT studies.

Why aview LCS matters and how it works

The AI assistant detects and diagnoses lung nodules on chest CT studies. It provides 2D and 3D size and volume information by segmenting nodules, and automatically classifies solid, part-solid, non-solid. An important function is the automated comparison of nodules in the CT follow up. aview LCS reports according to the guidelines of the Lung CT Screening Reporting and Data System (Lung-RADS Version 1.1), as recommended by the American College of Radiology. The results are presented in tabular form and with 2D and 3D images. Each individual nodule is described with its exact location, diameter, volume and its morphology. The clear reports in words and images are a welcome support for the transfer of knowledge from radiologists to patients and clinicians. If aview LCS is used for general lung cancer screening, a workload reduction of between 77.4% and 86.7% can be expected according to the reference in our “The scientific evidence” section. This AI assistant can be used both for individual patients and in large oncology departments.

Who benefits

Patients, clinicians and radiologists by the reliable detection of pulmonary nodules with clear reports. In particular, the 2D and 3D visualization of the lungs and the nodules are a welcome help for interdisciplinary and patient communication.

Our own experience at Radailogy

Coreline reports the performance data as: sensitivity 97%, specificity 76%, accuracy 91%, ROC AUC .76, respectively.  The AI assistant has high values ​​for PPV, NPV and sensitivity of more than 92% each in our own patient population for lung nodules larger than 10mm. Lesions are precisely located and described using the parameters diameter, volume and morphology. Two CT studies are compared in the follow-up setting. The status of each nodule is indicated as baseline, unchanged, smaller or larger, respectively. New nodules are reported as such. This automated comparison in follow-up lung CTs reduces much of the workload. However, we could not validate the reduction of the workload by 86.7% and the time saving of 70% suggested by the vendor.

We also evaluated aview LCS together with aview COPD, which was developed to detect and quantify pulmonary emphysema in lung CT studies. Find out more in our AI assistant menu!

The scientific evidence

Lancaster HL, Zheng S, Aleshina OO, Yu D, Yu Chernina V, Heuvelmans MA, de Bock GH, Dorrius MD, Willem Gratama J, Morozov SP, Gombolevskiy VA, Silva M, Yi J, Oudkerk M. Outstanding negative prediction performance of solid pulmonary nodule volume AI for ultra-LDCT baseline lung cancer screening risk stratification. Lung Cancer. 2022 Jan 6;165:133-140.

Data to upload to Radailogy

Non-enhanced low-dose chest CT studies of any CT scanner; axial reformations; slice thickness and interval below 1.25mm each; sharp lung reconstruction kernel

Coreline AI assistant

Do you know your risk of heart attack? Done quickly with aview CAC!

Non-enhanced chest CT of a 65-year-old patient; 120 Kvp; axial reformation; soft tissue reconstruction kernel. aview CAC segments all cardiac structures and detects coronary artery calcium in all coronary arteries, calculates an Agatston score of 2613, a visually estimated score of 2053, the total area of ​​calcifications of 2220.6 mm² and the equivalent amount of calcium of 471.8 mg. The score according to the CAC-DRS scoring system is 2613/N4 and represents a high risk of a heart attack.

Calcium deposits narrow the coronary arteries and increase the risk of a heart attack. Calcium scoring in a simple CT scan of the chest provides information about whether your coronary arteries are affected by this arteriosclerosis.

It is with great pleasure that we present aview CAC, an AI assistant for the CT of the heart.

Why aview CAC matters and how it works

Coronary artery calcium (CAC) is a marker of overall coronary atherosclerotic burden. As such, it is an important tool in cardiovascular risk stratification and preventive treatment of asymptomatic patients with unclear cardiovascular disease risk.

aview CAC is a new AI assistant for coronary artery segmentation and labeling. It detects and analyzes calcium in the coronary arteries using CT scans of the chest by measuring the Agatston score.

Patients with a high Agatston score are at increased risk of a heart attack.

Who benefits

Taking your age and gender into account, aview CAC can be used to calculate how high your risk of a heart attack is.

If you have already had a screening CT of your lungs, you can upload this study to Radailogy and you will receive information about this risk quickly and reliably.

If coronary artery calcium is detected, coronary disease is more likely, regardless of whether you feel symptoms or not. It also means that possible follow-up examinations (CT angiography of the coronary arteries or MRI of the heart) allow conclusions to be drawn about the development of the disease and the effectiveness of therapy.

Our own experience at Radailogy

aview CAC calculates the results according to the CAC-DRS Scoring System. The AI assistant uses the modifier “Ax” or “Vx” to represent the Agatston or visually estimated CAC score, respectively, with x corresponding to the CAC score category. Next, the number of affected arteries is outlined with the modifier “Ny,” with y corresponding to the number of affected categories.

Both modifiers are then combined and separated by a virgule to give a composite CAC-DRS score (Ax/Ny or Vx/Ny). The calculation is based on the weighted highest density score (HU) multiplied by the area of the calcification speck. The density score outlines the risk factor: 130-199 HU: 1; 200-299 HU: 2; 300-399 HU: 3; 400+ HU: 4.

The test is performed quickly and accurately with low interreader variation. In addition, aview CAC´s proprietary kernel conversion technology improves accuracy and performance for quick analysis. The results are demonstrated in clear numbers and well understandable pictures.

The scientific evidence

Vonder M, Zheng S, Dorrius MD, van der Aalst CM, de Koning HJ, Yi J, Yu D, Gratama JWC, Kuijpers D, Oudkerk M. Deep Learning for Automatic Calcium Scoring in Population-Based Cardiovascular Screening. JACC Cardiovasc Imaging. 2022 Feb;15(2):366-367.

Aldana-Bitar J, Cho GW, Anderson L, Karlsberg DW, Manubolu VS, Verghese D, Hussein L, Budoff MJ, Karlsberg RP. Artificial intelligence using a deep learning versus expert computed tomography human reading in calcium score and coronary artery calcium data and reporting system classification. Coron Artery Dis. 2023 Sep 1;34(6):448-452.

Suh YJ, Kim C, Lee JG, Oh H, Kang H, Kim YH, Yang DH. Fully automatic coronary calcium scoring in non-ECG-gated low-dose chest CT: comparison with ECG-gated cardiac CT. Eur Radiol. 2023 Feb;33(2):1254-1265.

Data to upload to Radailogy

Non-enhanced chest CT studies of any CT scanner; 120 Kvp; axial reformations; slice thickness and interval 2.5-3 mm each; soft tissue reconstruction kernel

ECR Vienna

For everyone who can still be amazed: meet us at the ECR 2025!

Radailogy and ERS at the ECR! Meet us in Hall X1 Booth A01 from February 26 to March 1, 2025!

Our world of Artificial Intelligence and Teleradiology up close

One of our great strengths is that we listen carefully to our partners and understand exactly how we design our services individually and precisely for each of our customers. This enables us to provide our AI assistants and our teleradiology in perfection, day after day and around the clock, for hundreds of thousands of patients, exactly the way people need us.

Because despite all the technology and maximum speed in daily practice, what matters most is the understanding and trust between us as humans.

Get to know our team at Radailogy and ERS personally

Live demonstration of our AI assistants with your own test studies

ERS TV Amenti Club: Be our live guest

With us through the congress jungle

Sofa, popcorn and cola during our  exclusive movie shows

Safe charging stations for your smartphone

Book your personal appointment now!

office@radailogy.com

Tel +41 41 763 33 10

We look forward to welcoming you in Vienna!

Your team at Radailogy and ERS

Radailogy´s AI assistant gleamer upgrade

New features for automated measurements of body axes on X-ray images: Part 2

Lateral radiographs of both legs (left) and the right knee joint (middle), radiography of the left ankle and forefoot a.p. (right). BoneView Measurements calculates the iliosacral body axes, the pelvic tilt and the femorotibial joint angles to determine the genu flexum and recurvatum (left). The Caton-Deschamps and Insall-Salvati indices (middle) as well as the Méary hindfoot angle (right) are precisely indicated.

We have the latest upgrade available for you! Gleamer´s BoneView Measurements of body axes come with interesting, new functions.  

What is new?

Caton-Deschamps and Insall-Salvati indices

The Caton-Deschamps index is used to measure patellar height and identify patella alta and patella baja. It relies upon the length of the patellar articular surface and its distance from the tibia.

The Insall-Salvati index is the ratio of the patella tendon length to the length of the patella and is used to determine patellar height.

Genu flexum and Genu recurvatum

Genu flexum describes the pathological reduction of full knee extension, also known as flexion contracture. Normal active range of motion is 0° extension and 140° flexion.

In Genu recurvatum, or back knee, the knee bends backwards. In this deformity, excessive extension of the femorotibial joint occurs.

Hindfoot angle on Méary´s views

Méary view X-rays measure the angular deviation of the hindfoot axis in order to assess hindfoot malalignment.

The scientific evidence

van Duijvenbode D, Stavenuiter M, Burger B, van Dijke C, Spermon J, Hoozemans M. The reliability of four widely used patellar height ratios. Int Orthop. 2016 Mar;40(3):493–497.

Kadakia N & Ilahi O. Interobserver Variability of the Insall-Salvati Ratio. Orthopedics. 2003;26(3):321-323.

Neri, R. Barthelemy, Y. Tourné. Radiologic analysis of hindfoot alignment: Comparison of Méary, long axial, and hindfoot alignment views. Revue de Chirurgie Orthopédique et Traumatologique. 2017;103(8):882-887.

Data to upload to Radailogy

Digital radiography of the skeleton

Radailogy´s AI assistant

New features for automated measurements of body axes on X-ray images: Part 1

Radiography of the pelvis and both hip joints of a boy with the acetabular angles precisely measured on both sides by the AI ​​assistant (left).

Frontal radiography of both forefeet of a 55-year-old patient. On the right (on the left in the picture) there are normal joint angles of the forefoot after osteomy of the first metatarsal bone. There is a hallux varus deviation on the left (on the right in the picture). The AI ​​assistant measures the respective joint angles accurately.

We have the latest upgrade available for you! Gleamer´s BoneView Measurements of body axes come with interesting, new functions.

What is new?

Risser index

The Risser index is used to grade skeletal maturity for patients up to 18 years of age based on the degree of ossification and fusion of the iliac crest apophyses. It is primarily used as a marker of skeletal maturity, a surrogate for growth rate and potential, to plan scoliosis correction.

Acetabular angle for congenital hip measurement

The acetabular angle, or Sharp’s angle, is used to assess developmental hip dysplasia, particularly in patients with already ossifying epiphyses and therefore limited sonographic assessment.

Lumbar spine

The performance on lateral view measurements of the lumbar spine has significantly improved. Furthermore, lordosis is now calculated between L1 and S1, instead of between L1 and L5.

The scientific evidence

Hacquebord J, Leopold S. In Brief: The Risser Classification: A Classic Tool for the Clinician Treating Adolescent Idiopathic Scoliosis. Clin Orthop Relat Res. 2012;470(8):2335-2338.

Lee Y, Chung C, Koo K, Lee K, Kwon D, Park M. Measuring Acetabular Dysplasia in Plain Radiographs. Arch Orthop Trauma Surg. 2011;131(9):1219-1226.

Data to upload to Radailogy

Digital radiography of the skeleton

AI assistant brainscan

Acute and chronic pathologies at a glance: precise CT diagnostics of the brain

Non-enhanced cerebral CT of a 61-year-old patient after a motor vehicle accident. There is acute intraparenchymal, subdural, and subarachnoid hemorrhage along the right hemisphere (left) and a nondisplaced occipital skull fracture (middle left).

Brainscan CT detects and reports all details of intracranial hemorrhage and skull fracture with high accuracy as a heat map (middle right) and also tabulated (right).

Not every patient with symptoms of acute intracranial pathology has a corresponding CT correlate, but rather a chronic cerebral process – and vice versa. Therefore, the comprehensive detection of all intracranial pathologies is one of the main tasks of neurologists and radiologists, be it in acute medicine or in routine diagnostics.

It is with great pleasure that we present Brainscan CT, an AI assistant for the detection of acute and chronic intracranial pathologies in CT studies.

Why Brainscan CT matters and how it works

The AI ​​assistant reports acute and chronic intracranial processes in CT scans. Using tables and heat maps, it gives neurologists, radiologists and emergency physicians a direct view of crucial brain pathologies.

Any medical professional can use Brainscan CT for each individual emergency patient by quickly and easily uploading cerebral CT studies to Radailogy. In medical institutions, this AI software can also do its work automatically in the background in order to fully benefit from its triage potential.

Any medical professional can use Brainscan CT by quickly and easily uploading cerebral CT studies to Radailogy. In acute medicine, this AI assistant can also be integrated into the workflow as a standard to fully utilize triage protocols.

Who benefits

Patients, clinicians and radiologists through the comprehensive detection of intracranial pathologies and the outstanding presentation of the results in tables and heat maps.

Our own experience at Radailogy

Brainscan CT detected intraparenchymal, subdural, epidural and subarachnoid hemorrhages with high accuracy in our test series. This corresponds to the performance data given by the manufacturer: sensitivity of an average of 85% with a specificity of at least 95%. Skull fractures were recognized well, even if the sensitivity is only 51% according to the manufacturer. Acute infarctions were detected sufficiently well, although the differentiation from chronic processes was not without exceptions, correlating with a sensitivity of almost 60% and a specificity of 99%. Other pathologies detected by Brainscan CT include: vascular lesions in general, leukoencephalopathy, edema, atrophy, calcifications, and tumors. We were not able to test the latter in detail.

The results are presented using tables. The presence of intracranial pathologies is given as a percentage – as an expression of probability – and is also represented with a bar chart. What initially takes some getting used to is that the specification of 51% already means the detection of individual lesions. The AI ​​assistant produced clear results in the vast majority of our test series. We only observed statements of 50% probability in exceptions in which even radiologists would not naturally come to a clear opinion.

In the current version, Brainscan CT also shows intracranial hemorrhages and leukoencephalopathy using impressive heat maps. The results are delivered directly to the PACS as DICOM images.

Data to upload to Radailogy

Non-enhanced cerebral CT studies of any CT scanner for patients aged 18 and older; axial reformations; maximum matrix size 512 x 512; maximal slice thickness 5 mm; soft tissue reconstruction kernel

LucidaMedical | AI assistant

MRI of the prostate: Convincing detection and analysis of prostate cancer

Axial T2 (upper left and right), contrast enhanced T1 (DCE, lower left) and DWI (lower right) MRI of the prostate of a 52-year-old patient with a Gleason Score of 4. T2 hypointensity in the middle peripheral zone on the right with corresponding hyperintense DWI signal and marked hypervascularization. Prostate Intelligence has detected (overlaid to T2 axial, upper left) and rated the lesion as AI-Likert 4.3. The AI assistant detected additional non suspicious nodular lesions in the central, transitional and left peripheral zones, respectively (overlaid to T2 axial, upper left). Prostate Intelligence quantified the prostate volume as 51 ml (not shown). Histopathology confirmed the lesion in the right peripheral zone malignant.

MRI of the prostate is an important area of oncological radiology. It takes years of radiological experience to distinguish malignant lesions from benign changes. Furthermore, prostate imaging is an excellent example of close collaboration between radiologists and clinicians. How should the MRI be evaluated in regard to the Gleason score? How stringent is the topographical depiction of the lesions? Which lesions are determined as biopsy targets?

It is with great pleasure that we present Prostate Intelligence, an AI assistant for the detection and analysis of prostate cancer in MR studies.

Why Prostate Intelligence matters and how it works

Prostate Intelligence helps detect and analyze prostate cancer in MR studies. The results are clearly structured with heat maps and tables and enable the selection of biopsy targets. The evaluation of the results is based on the PI-RADS classification. Prostate Intelligence helps radiologists and clinicians save time, particularly when it comes to organ and tumor segmentation. The interdisciplinary case discussions improve in quality.

Who benefits

Clinicians and radiologists through the detailed visualization and diagnosis of prostate cancer in comprehensive images.

Our own experience at Radailogy

Prostate Intelligence convinced us in many ways. The sensitivity, NPV and AUC are each reported as >90% at an AI score threshold of 3.5. According to the AI manufacturer, Lucida Medical, the specificity of at least 78% is only achieved with a Gleason score of 4. Our tests based on our own patient data even outperformed the manufacturer’s data with a Gleason score <4. We observed a high TN rate of >95%. The classification of prostate tumors is given as a five-point AI Likert scale and is based on the PI-RADS score. Prostate Intelligence automatically calculates the prostate volume. The segmentation work is also pleasingly detailed, saves time and provides precision for radiological diagnosis and knowledge transfer to clinicians and patients. Prostate Intelligence can be seamlessly integrated into your daily workflow.

Any medical professional can use Prostate Intelligence for each individual patient by quickly and easily uploading MRI studies of the prostate to Radailogy. Our telemedicine customers also use this AI assistant as a standard in daily practice to optimize their oncology workflow.

The scientific evidence

Sushentsev N, Moreira Da Silva N, Yeung M, Barrett T, Sala E, Roberts M, Rundo L. Comparative performance of fully-automated and semi-automated artificial intelligence methods for the detection of clinically significant prostate cancer on MRI: a systematic review. Insights Imaging. 2022 Mar;13(1):59

Data to upload to Radailogy

1.5-3.0 Tesla, imaging planes should be the same across T2, DWI and DCE; T2: recommended slice thickness 3mm, imaging resolution <0.65mm; DWI & ADC: TE ≤90 msec; TR ≥3000 msec, slice thickness ≤4mm, no gap, resolution ≤2.5mm phase and frequency, high b-value ideally 800-1000; Contrast enhanced T1 (DCE): TR/TE <100msec <5msec, slice thickness 3-4.5mm, no gap, resolution ≤2mm, post contrast total observation >2min. Ideally the enhancement peak should occur at least 1min before observations stop. There is no need for DCE observations longer than 3min.

Radailogy

Faster diagnoses for the chest X-ray in words and pictures

Chest radiography of a 65 years old patient with symptoms of lower respiratory tract infection. Multiple lung opacities and consolidations are visible in projection to the lower lung lobes as well as the middle lobe. Rayscape correctly identifies all consolidations (red) and opacities (green). Rayscape rates the probability for viral disease as intermediate (3 out of 6) and correctly suggests bronchopneumonia as the differential diagnosis. In addition, some small lung lesions are reported (pink) that were initially missed by the radiologists.

Chest radiography is one of the most common radiological examinations of all, and it is also an essential first-line imaging modality in hospitals and doctors´ offices. The precision in reporting and the communication of results from radiologists to patients and clinicians are the most important success factors for any optimal discussion of findings and therapy.

It is with great pleasure that we present Rayscape, an AI assistant for chest radiography.

What Rayscape is and how it works

Rayscape increases accuracy in detecting 17 major thoracic pathologies.

Thoracic findings are reported and visualized in tabular form. For each finding, the true positive rate is presented as a degree of probability versus differential diagnoses, especially for pulmonary nodules, pneumonia, and mediastinal pathologies. The clear presentation of findings is a welcome support for knowledge transfer from radiologists to patients and doctors.

Who benefits

Patients, clinicians and radiologists by identifying the most important chest diseases and injuries with a clear presentation of the findings in words and pictures.

Our own experience at Radailogy

We tested Rayscape for several years and brought it to life with the manufacturer. We reviewed the performance data and compared it to our own observations:

Rayscape supports the detection of pulmonary nodules, pulmonary consolidation, pulmonary edema, pulmonary emphysema, interstitial lung disease, tuberculosis, pneumothorax, pleural effusion, atelectasis, cardiomegaly, hilar and mediastinal pathologies, diaphragmatic abnormalities, fractures, scoliosis, catheters and drains. From our point of view, Rayscape achieves the best results in the detection of pneumonia, including viral pneumonia with probability grading from 1 to 6, pulmonary nodules, pneumothorax, pleural effusions, cardiac decompensation, consolidations and atelectasis.

The performance

Rayscape has a high level of accuracy in detecting 17 major chest pathologies. Area Under the Receiver Operating Characteristics (AUROC) is highest for tuberculosis (99.1), pneumothorax (97.4), pulmonary edema (94.7), consolidations (94.6), lowest for interstitial lung disease (81, 5), scoliosis (82), diaphragmatic anomalies (85.4), and hilar and mediastinal pathologies (87.7).

Data to upload to Radailogy

Digital radiography of the chest p.a. or a.p.