Purpose:
The aim of the study was to prospectively determine the performance of an AI assistant in acute abdominal organs, validated with the first read reports of radiologists specialized in emergency radiology as well as imaging and clinical follow-up.
Patients, Materials und Methods:
In 2025, 200 patients (age: 18 to 88 years, mean: 55 years, standard deviation: ± 15 years) who had been referred to ERS Emergency Radiology Schueller, a provider of teleradiology services, for abdominal CT scans due to suspected acute abdominal organ disease, were randomly and prospectively enrolled in the study over ten consecutive weeks. The CT scans of these patients were evaluated using the AI assistant xAID (Dover, DE, USA). The AI assistant offered assessments for acute cholecystitis, acute pancreatitis, acute appendicitis, and acute diverticulitis. Radiologists reported the CT studies without the initial knowledge of the AI results and compared the radiological with the AI findings in a second step. Gold standard were the specialists´ reports as well as imaging and clinical follow-up. In case of discrepancies between the radiologists´ and the AI assistants´ findings, CT studies were second read within 30 minutes at the latest.
Results:
Of 200 patients, 54 AI results could not be retrieved. For 146 patients, radiologists and clinical follow-up diagnosed 31 patients with acute cholecystitis (21%), 30 with acute pancreatitis (20%), 25 with acute appendicitis (17%), and 15 with acute diverticulitis (10%). The results yielded by the AI assistant are given for acute cholecystitis in Table A, for acute pancreatitis in Table B, for acute appendictis in Table C, and for acute diverticulitis in Table D; true positive (TP), false positive (FP), false negative (FN), and true negative (TN) in absolute numbers; sensitivity, specificity, positive predictive value (PPV), and negative predictive value (NPV) in percent.
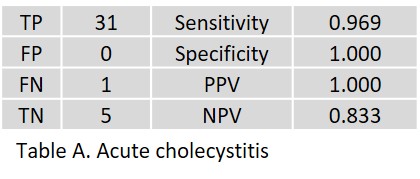
In acute cholecystitis, one FN resulted from a marked hydrops and gallbladder wall thickening, which was confirmed surgically and histologically.
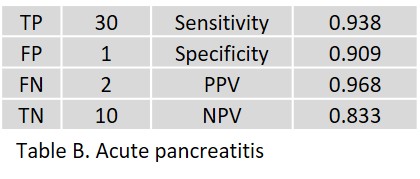
In acute pancreatitis, one FP was observed without any positive imaging signs. Two FN occurred in patients with CT signs of an onset acute pancreatitis.
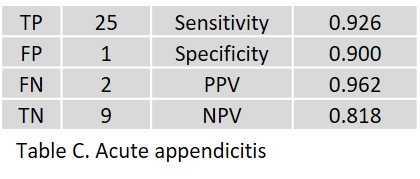
In acute appendicitis, one FP was detected in a radiologically and clinically negative case. The two FN were significantly underestimated despite the clearly positive CT scan and clinical symptoms.
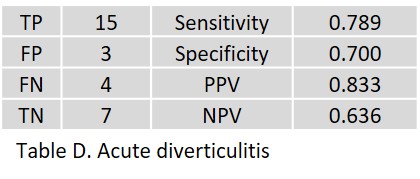
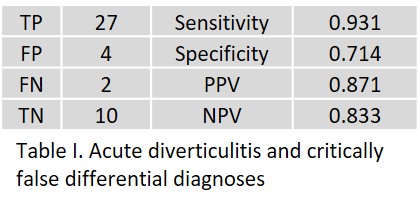
In acute diverticulitis, two FP occurred as a result of misinterpretation of reactive inflammation of the mesentery in acute cholecystitis. One FP occurred in a patient with severe pancolitis (inflammatory bowel disease) that differed significantly from diverticulitis clinically, pathologically, histologically, and radiologically. All four false-negative findings were located in the left colon.
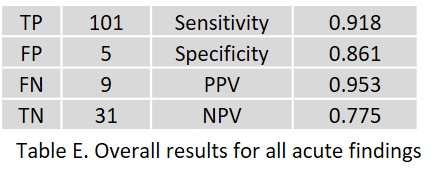
Table E shows the overall results for all acute pathologies.
For patients in a state-of-the-art teleradiology setting, the probability of a positive CT scan for an acute abdominal organ disease is usually high.
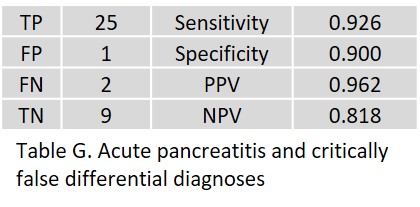
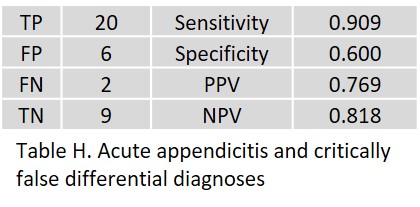
Therefore, as a second step, the complexity of acute abdomina in both, the clinical presentation as well as CT imaging, was addressed. Here, the AI results were not only regarded as Yes/No answers, but rather considered results triggering treatment. In nine patients, the AI assistant revealed more than one positive result. The results regarding any critical false positive or false negative differential diagnoses are shown in Tables F to I.
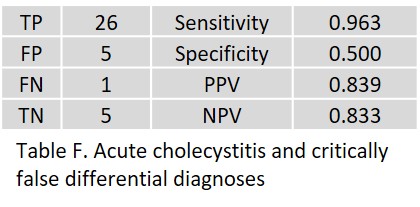 In particular, one patient with acute appendicitis was FP, as were two patients with acute pancreatitis.
Acute appendicitis was FP in two patients.
Here, the FP differential diagnoses do not matter that much, since these patients undergo surgery anyway.
Notably, acute appendicitis was FP in one patient.
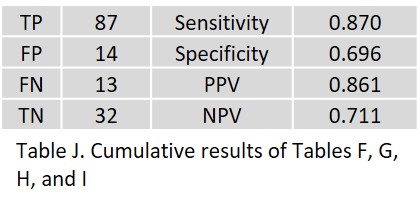
The overall result shown in Table J is obtained by summing the respective organ results.
Discussion:
To our knowledge, our study is the first to examine abdominal CT and AI in the context of acute abdominal organ diseases. Compared to physicians, AI developers tend to take a more pragmatic approach to pattern recognition, segmentation, and description of abdominal organs. This AI assistant divides the abdominal cavity primarily based on four main criteria. While such algorithms may prove suitable for delineating a single parameter, such as a single organ, the lack of human sensitivity to the overall picture becomes particularly evident in cases of the acute abdomen. Especially in cases of acute cholecystitis and acute appendicitis, the results worsen when the AI assistant is used to stratify treatment options. In acute appendicitis, the reasons may also include the often unusual location of the appendix, especially in complicated abdominal cases, which corresponds to the most common situation in teleradiology. It is important to be aware that an AI assistant is not able to depict the course of an acute abdominal illness, as CT patterns can change from local inflammation to regional phlegmon to diffuse peritonitis and perforation.
In summary, the results of the AI assistant are promising. This study underscores the urgent need for ongoing and competent collaboration between radiologists and software developers to create clinically relevant, powerful AI assistants.
Gerd Schueller and the Radailogy Team


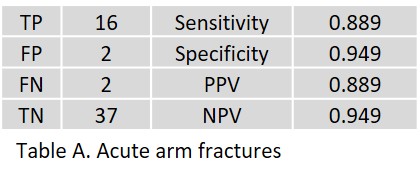 In acute arm fractures, 2 FP of the proximal radius and the scaphoid were observed (ages 78 and 65 years, respectively). Two FN with minor radiolucency lines of the distal clavicle as well as the posterior circumference of the humeral head were observed, which were confirmed as fractures in radiological and clinical follow-up.
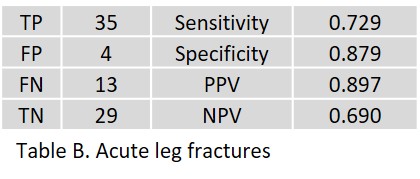 In acute leg fractures, 4 FP of the femoral neck, greater trochanter (age: 71 and 80 years, respectively), lateral tibial plateau (age: 52 years), and navicular bone (age: 76 years) were observed. Thirteen FNs included short, small avulsions of the talus (age 49 to 73 years), nondisplaced Weber A fractures of the distal fibula (age 28 to 46 years), a minimal fracture of the navicular bone (age 25 years), and a small subtrochanteric avulsion of the proximal femur (age 79 years).
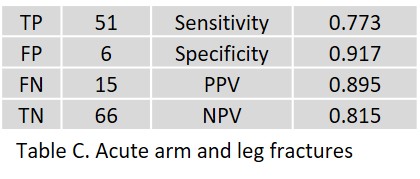 Table C shows the overall result.